


Article
CAPE Ratio: Why Today's Stock Market Looks Like the Dot-com Bubble

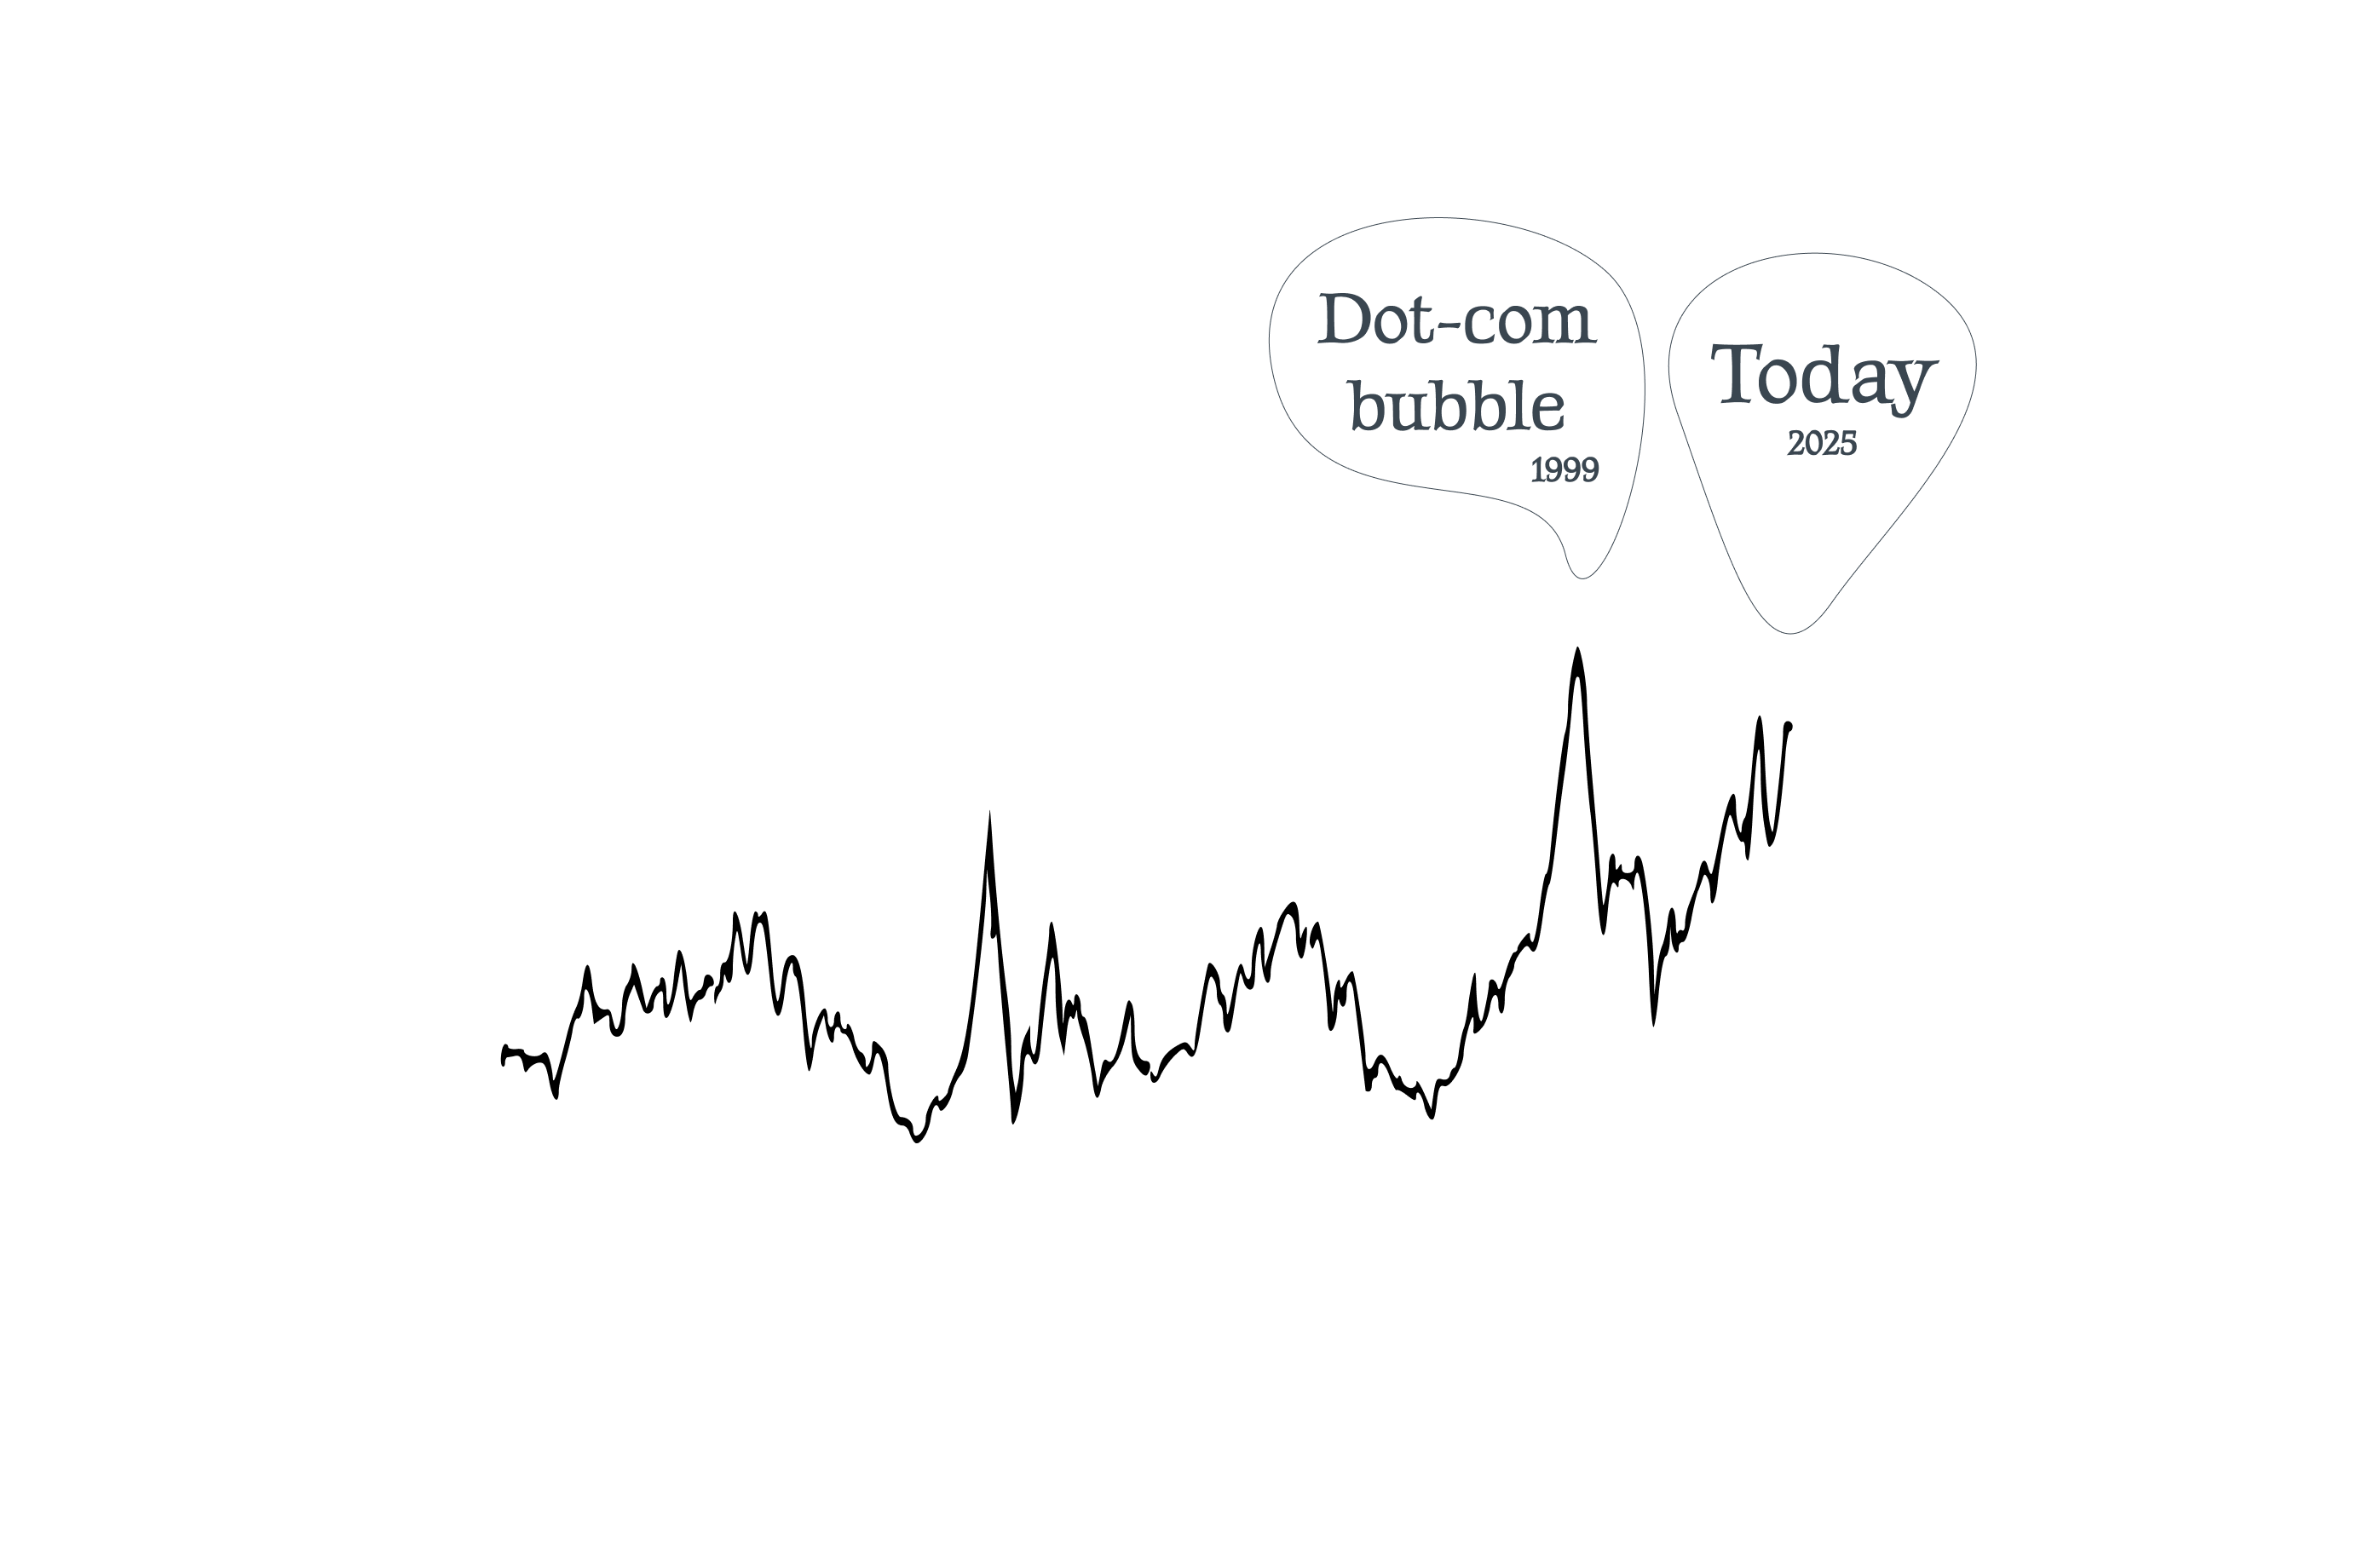
Do you know what the Cyclically Adjusted Price-to-Earnings Ratio (CAPE) is? If not, you probably should. Right now, we are at levels reminiscent of the dot-com bubble at the turn of the millennium.
How to Measure Stock Market Valuation
CAPE, also known as Shiller P/E (developed by Nobel laureate Robert Shiller of Yale University), is a way to determine whether stocks are expensive or cheap. It works by comparing the price of stocks in the market to the average earnings of companies over the past 10 years, adjusted for inflation. Think of it as a tool that smooths out short-term fluctuations and gives us a long-term perspective on whether the market is overvalued (too expensive) or undervalued (cheap). If CAPE is high, it suggests that stocks might be overpriced, reducing the likelihood of high investment returns in the future. The only exception would be if companies’ earnings were to grow dramatically in the upcoming years, far more dramatically than what we saw even during the rise of the internet, one of the biggest technological revolutions in history.
The Story of the Dot-com Bubble
In the 1990s, the internet emerged as a revolutionary technology that promised unlimited possibilities. Startups with vague business models but promising names began to achieve billion-dollar valuations, often without generating real profits. Investors, driven by optimism and the fear of missing out, poured money into any company with ".com" in its name.
At the height of the dot-com bubble, the CAPE for the S&P 500 reached 44.2, the highest figure in modern history. This indicator suggested that the market was extremely overvalued. When investors realised that many of these companies would never be profitable, the sell-off began. By 2002, the Nasdaq index had dropped by more than 75%, and many internet companies had disappeared. For those who invested at the height of the bubble in 2000, it took more than a decade for their investments to regain the same real value. This prolonged recovery was not only due to falling prices but also the impact of inflation, which further eroded the actual value of invested funds.
The Shiller PE Ratio in 2025
Today, CAPE for the S&P 500 sits at around 38, significantly above the historical average of approximately 16-17.
History does not replay itself, but its parallels cannot be ignored.
Disclaimer
This article is intended for informational and educational purposes only. It does not constitute financial advice, a recommendation to buy or sell any securities, or a guarantee of future market performance. The views expressed are solely those of the author, who may also be an investor. Investing in financial markets involves risk, and each reader should make their own decisions independently and, if necessary, consult with a licensed professional.
Sources
Summary
Common questions on this article's topic
What is the CAPE ratio?
What was the CAPE ratio during the dot-com bubble?
What is the CAPE ratio today and what does it signal?
What happened during the dot-com bubble?
Does a high CAPE ratio guarantee a market crash?
How can the CAPE ratio help individual investors?
What is the difference between the Shiller PE ratio and a normal P/E ratio?
Are we in a stock market bubble right now?
Are we in an AI bubble like the dot-com bubble?
If you have any thoughts, questions, or feedback, feel free to drop me a message at mail@richardgolian.com.
 LinkedIn


Related articles
In April, in the first part of this series, I wrote about an AI prediction system I had started building on my own machine. At the time the software was a few hours old and the prediction record was empty. The record since then has shown one thing: the system does not yet understand the market it is being asked to forecast. It can pull macro context, book value, earnings. But it cannot put those together into something that helps it understand the price.
Prague, 13 May 2026. On my way to work I started thinking about something that stayed with me for days. If most routine work on a computer disappears in the next ten years, and a large share of repetitive manual work disappears with it, what happens to the flow of money? Who pays whom for what? Which economic layers will exist, how large will they be, and what relationships will run between them? This is the six-layer map I sketched as an answer.
I am building an AI system to predict the S&P 500. It runs on my own machine, uses free public data (yfinance, FRED, the Shiller dataset), and grades every forecast against reality. This series documents the build itself: the decisions, the methodology, the mistakes. What I will eventually share from the running system is a separate question, and an honest one.
More articles
A few weeks ago I installed a small local AI model on my laptop that watches a live camera feed. I turned the webcam on in the dark, and in near total darkness it recognised me and the objects in the room. That such things exist, I have known for a long time. What opened my eyes was the accessibility. I installed it in one prompt, free, and it runs entirely on my machine, sending data nowhere.
I have Heidegger and my notebook beside me. I am asking where all of this is heading, where artificial intelligence is taking us.
Seventy per cent. That is where the first AI output begins, even when you give it the full company context and the best examples from the past. We are talking about the kind of output that cannot be defined programmatically. It is more complex. Often it is creative work. On one repeated type of output I reached eighty per cent within a week. Every further percentage point is harder than the one before.
For a long time we treated the internet as the main road. The place where work and relationships happen. Yet most of what we see on it today is, or soon will be, AI-generated: text, images, profiles and comments. The internet is turning into an online game full of bots, where you cannot be sure that a human is on the other side of anything. So I ask: was the online world the main road, or only a temporary detour that part of us will return from, back offline?
A few days ago I interviewed a senior marketer. An experienced man, years of practice. I asked him about AI. He said he barely uses it. He had one bad experience with the output and decided he was too senior for it to add value when it is not perfect. I know the other side too: professionals who automate everything that can be automated.
Europe does not have the capacity to face a full-scale, mass drone war of the kind we see in Ukraine. Three dependencies weaken it: China supplies the physical material for defence systems, the United States supplies capabilities Europe does not have, and twenty-seven states cannot agree how fast, or who pays. Rearmament plans exist, but they are being carried out slowly.
AI produces the graphic, the newsletter and the product page faster than a person. What is left for the one who used to do it is the judgement, knowing whether the output is good. But most people have worse judgement than AI. And whoever cannot judge quality cannot delegate either. How do you tell whether yours is the judgement a company relies on, or the kind it can replace?
Four days in Catalonia. No computer, no AI, almost no social media. I bought this notebook so that I could write down what I would think about, and what I would come across and learn on the trip.