


Article
What Determines a Stock Price?

In April, in the first part of this series I wrote about an AI prediction system I had started building on my own machine. At the time the software was a few hours old and the prediction record was empty. The record since then has shown one thing that was, on reflection, predictable: the system does not yet understand the market it is being asked to forecast. It sees the price, a number. It can pull macro context, the book value of the companies in the index, the earnings. But it cannot put those things together into something that helps it understand the price.
I needed to simplify it for the system. I started by showing it what a price is made of.
I started building a new baseboard for the system. For any historical day on the S&P 500 or a sector fund, it decomposes the price into six numbers. The book value of the companies in the index. The premium the market pays above it for the companies' earnings. The contribution of the broader macroeconomic situation. The contribution of events. Media attention. And an arithmetic remainder I cannot yet fully name.
The thing I used to keep in spreadsheets and called the mood thermometer, which I wrote about in the past, worked from the same instinct. But that record, unlike the system I am building, worked more interpretively, more contextually, than this simplifying quantitative way. I now need to simplify first and add context gradually. Because I know that too much information, without a good explanation of how the pieces relate, can break the logic entirely.
Below I describe the six components of the price, one at a time. Then I share what surprised me on the chart when I looked back at my own best entries. And finally, what this step means for the predictive side of the system.
So what determines a stock price? The price of a share, or of a whole index, is made of six parts: the book value of the companies, the premium investors pay for their earnings, the macroeconomic situation, individual events, media attention, and a residual that cannot be fully explained. But the part that matters most is the future. A price is really the market's estimate of how much those companies, or that sector, will earn later on. And that is the harder part. My tool does not compute it yet. For now it can only break down the price from the past. How to work out the future part is what I am still figuring out.
How stock prices are actually determined
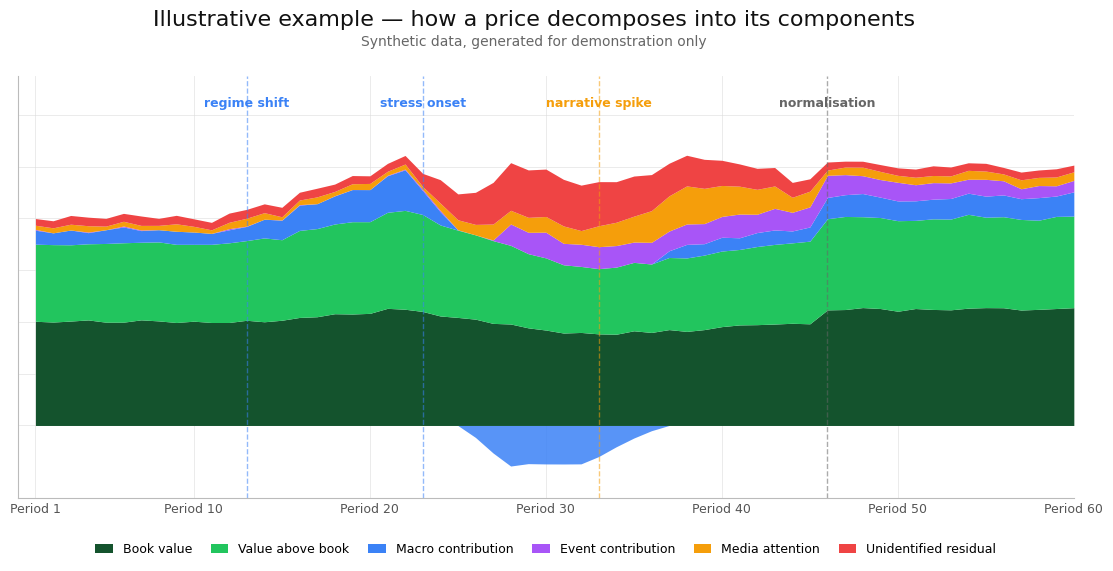
Six components sum to the price of the index to within a cent. Each has its own coloured band on the chart.
Book value, the bottom band. The price divided by the price-to-book ratio of the companies in the index. It represents the price the index would carry if all earnings premium, macro effect, media coverage and any other unidentified influence fell to zero: only the book value of the companies, scaled to today's share price. This is the first foundational layer of the chart, on which everything else sits.
Earnings premium. What investors pay above book value for the companies' ability to earn. Computed from long-run price-to-earnings and cyclically adjusted ratios, the same CAPE percentile against history from 1871 that I used in the first version of the prediction tool to classify market regimes. When this band grows on its own, the market is paying a higher premium for the same companies sitting behind it.
Macro contribution. Depends on a broad set of indicators: credit spreads, volatility indices, currency moves, real yields, inflation expectations.
Event contribution. Discrete impulses, not a continuous band. War, political shifts, an unexpected piece of news.
Media attention. A local language model scores the tone of the week's headlines on the asset.
Unidentified residual, the top band. The arithmetic remainder after the four observable parts of the price. I originally called this part of the chart sentiment. That was a quiet lie: the system did not measure sentiment, it computed a residual and labelled it with a word that suggested more than there was. The renaming itself was an honest step. The system will at least be aware that it does not know everything, and can reflect that in the future when assigning probabilities.
When the system started, this unidentified residual was more than half of every increment of the chart and was called sentiment. Two weeks of work on accounting for macro impact reduced it to a small part of the price.
The sum of these parts equals the price of the index or fund to within a cent.
What I saw, what I did not expect
When I had the chart ready for the first time, I looked back at the periods in which I had made the most money on shares. The entries were in phases the chart now shows as almost pure green. Book value and earnings premium were what I had paid for, not media hype or a temporary macro situation.
Join the Library
Full access to my findings, personal stories, and what I learn from the people I meet.
Join the Library · €29.99 per yearGet the full article by email and feel free to reply if you want to discuss it further.
Disclaimer
Sources
Summary
Common questions on this article's topic
What determines a stock price?
How does the stock market work?
What does it mean to decompose a stock price into components?
What is the CAPE percentile?
Why does the system not compute fair value when data is missing?
Can an LLM forecast individual price components on its own?
What is vibecoding and why is tuning a project so hard?
Is this tool investment advice?
If you have any thoughts, questions, or feedback, feel free to drop me a message at mail@richardgolian.com.
 LinkedIn


Related articles
I am building an AI system to predict the S&P 500. It runs on my own machine, uses free public data (yfinance, FRED, the Shiller dataset), and grades every forecast against reality. This series documents the build itself: the decisions, the methodology, the mistakes. What I will eventually share from the running system is a separate question, and an honest one.
AI produces the graphic, the newsletter and the product page faster than a person. What is left for the one who used to do it is the judgement, knowing whether the output is good. But most people have worse judgement than AI. And whoever cannot judge quality cannot delegate either. How do you tell whether yours is the judgement a company relies on, or the kind it can replace?
Prague, 13 May 2026. On my way to work I started thinking about something that stayed with me for days. If most routine work on a computer disappears in the next ten years, and a large share of repetitive manual work disappears with it, what happens to the flow of money? Who pays whom for what? Which economic layers will exist, how large will they be, and what relationships will run between them? This is the six-layer map I sketched as an answer.
More articles
The same task, two models. Fable 5 against Opus 4.8. On paper Fable is the better model, with a larger context and stronger specs. And still it lost. Opus handled the task with a single round of checking for 721,000 tokens, while Fable needed nine rounds and burnt through 2.78 million tokens. The difference was not in the model, but in how I set the task. And I know it, because I measured it.
A few weeks ago I installed a small local AI model on my laptop that watches a live camera feed. I turned the webcam on in the dark, and in near total darkness it recognised me and the objects in the room. That such things exist, I have known for a long time. What opened my eyes was the accessibility. I installed it in one prompt, free, and it runs entirely on my machine, sending data nowhere.
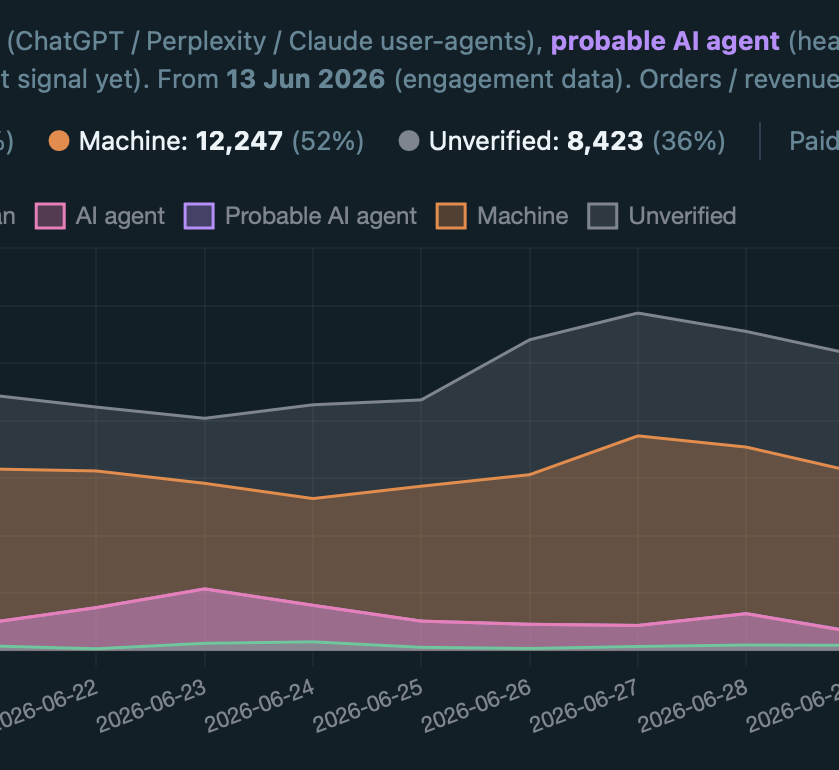
I once wrote about building my own privacy-friendly analytics tool. It had bot detection from the first version, yet it was not enough. Direct visits took a strangely high share of my traffic. When someone claims that 20% of their visits are bots and 80% are humans, I used to think the same. Today I would say the opposite ratio is closer to the truth. This is how I got there.

I have Heidegger and my notebook beside me. I am asking where all of this is heading, where artificial intelligence is taking us.
Seventy per cent. That is where the first AI output begins, even when you give it the full company context and the best examples from the past. We are talking about the kind of output that cannot be defined programmatically. It is more complex. Often it is creative work. On one repeated type of output I reached eighty per cent within a week. Every further percentage point is harder than the one before.
For a long time we treated the internet as the main road. The place where work and relationships happen. Yet most of what we see on it today is, or soon will be, AI-generated: text, images, profiles and comments. The internet is turning into an online game full of bots, where you cannot be sure that a human is on the other side of anything. So I ask: was the online world the main road, or only a temporary detour that part of us will return from, back offline?
A few days ago I interviewed a senior marketer. An experienced man, years of practice. I asked him about AI. He said he barely uses it. He had one bad experience with the output and decided he was too senior for it to add value when it is not perfect. I know the other side too: professionals who automate everything that can be automated.
Europe does not have the capacity to face a full-scale, mass drone war of the kind we see in Ukraine. Three dependencies weaken it: China supplies the physical material for defence systems, the United States supplies capabilities Europe does not have, and twenty-seven states cannot agree how fast, or who pays. Rearmament plans exist, but they are being carried out slowly.

Four days in Catalonia. No computer, no AI, almost no social media. I bought this notebook so that I could write down what I would think about, and what I would come across and learn on the trip.