


Article
Can AI Predict the Stock Market? Building a Calibrated System

In July 2024 I wrote about the changing moods of the stock market. I described tracking valuation ratios alongside media narratives as a mood thermometer. That article ended with a line I have come back to often: the stock market is a reflection of collective human emotions and behaviours.
The question is, can AI help me analyse and predict it? Can AI predict the stock market? Not with point precision, and any system that claims otherwise should be ignored. What it can do is produce calibrated probabilities over price movement and valuation regime. Then it tracks whether those probabilities hold across hundreds of forecasts. That is the system I am building.
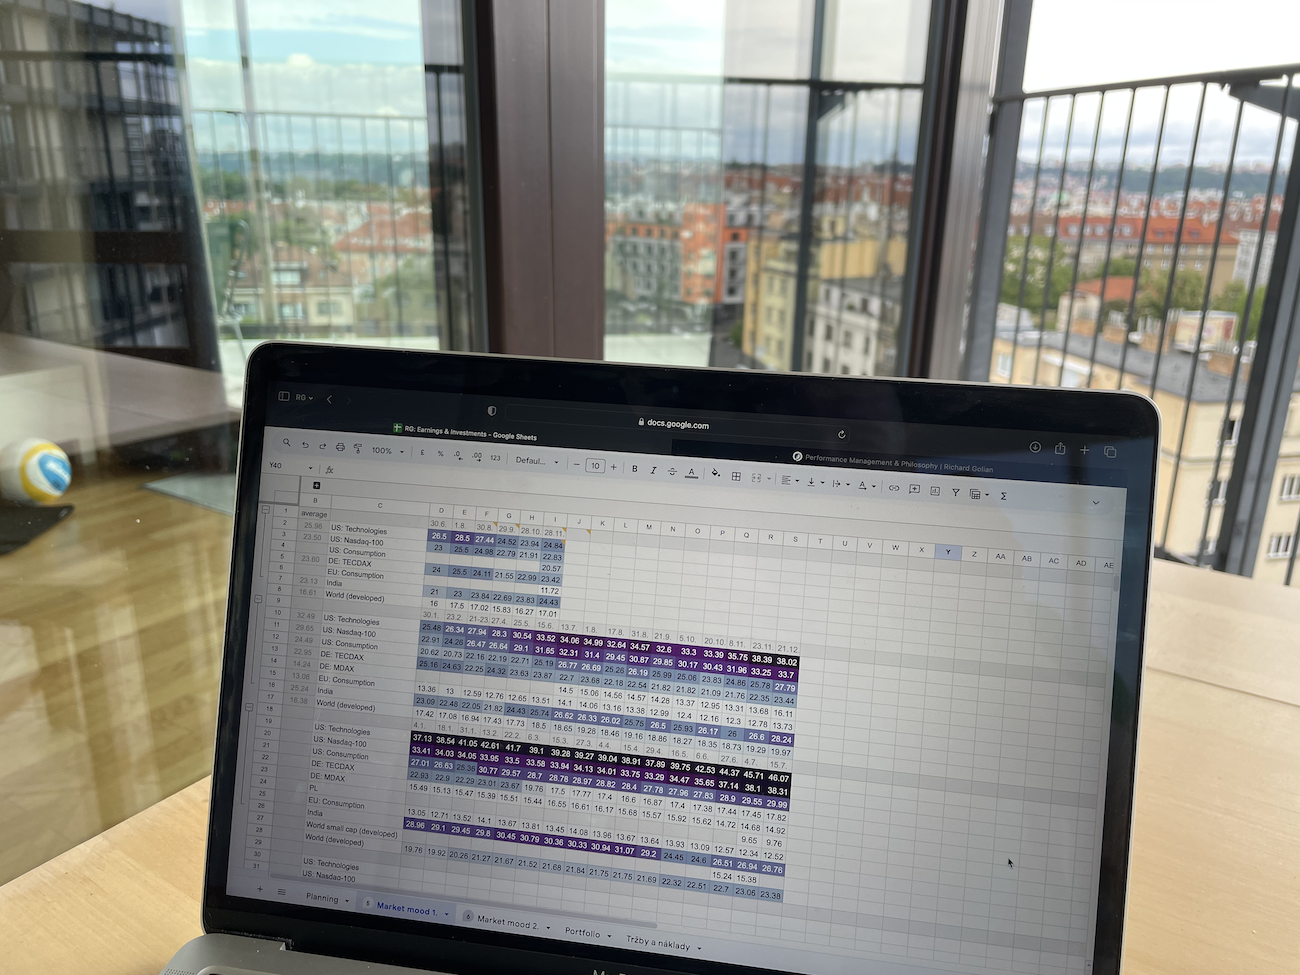
Two years later, that thermometer still lives in a Google spreadsheet: valuation ratios in columns, my own commentary on what the financial press was saying alongside them. It works for me. It does not work for anyone else. And more importantly, it cannot be tested. I cannot point to a calibrated record of how often my readings have been right, how often they have been wrong, or whether I am better than a coin flip when I claim to see elevated valuation.
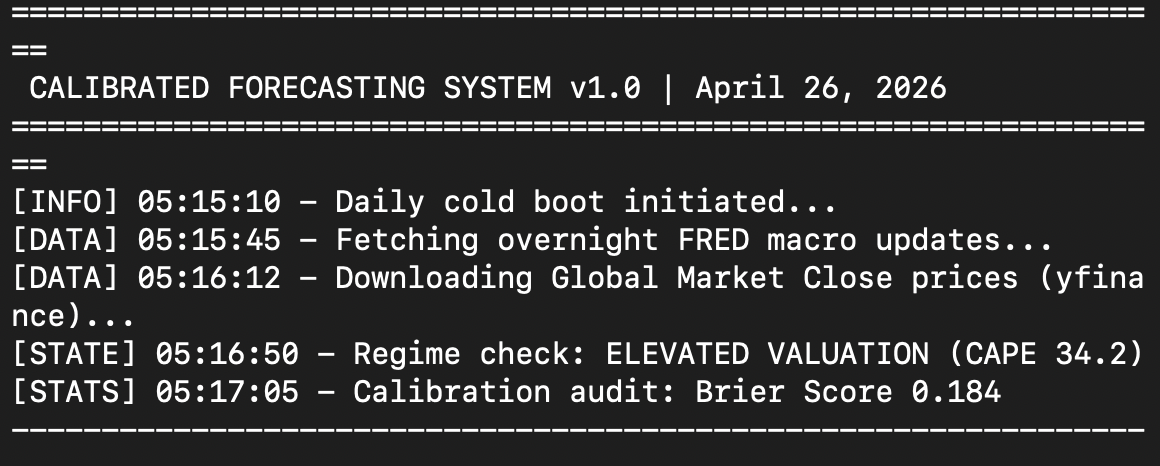
So I decided to build something. I have been at it since five this morning. I am writing this at eight. The first version is now running on my own machine. The pipeline works end to end. It does not yet have enough graded predictions in it to tell me anything meaningful. That part is just beginning. This article is the first in a series that documents the build itself, and what the system tells me once the record starts to fill up.
WHAT IS A CALIBRATED PREDICTION SYSTEM BUILT ON?
Three older articles converge into the design of what I have built. Each is a separate idea. Together they form the spine.
The first is risk-reward asymmetry. Every prediction the system emits comes with explicit probabilities and a confidence number. It has to answer the question I keep asking myself out loud. If I am wrong, how much do I lose? If I am right, how much do I gain? And is the ratio in my favour?
The second is decision quality over decision outcome. It runs through both Decision-Making in Marketing and Advertising Under Uncertainty and I make mistake after mistake. The primary metric is not hit-rate. It is calibration error. When the system says 70 per cent, does the world deliver 70 per cent? A predictor that says 95 per cent and is right 80 per cent of the time is more dangerous than one that says 70 per cent and is right 70 per cent of the time. The build enforces this in its own UI. Hit-rate is never reported without calibration error next to it. The numbers will only become meaningful once the record has enough graded predictions in it. A later article in this series will go into how the comparison is computed.
The third is the mood thermometer. I described it as my way of reading the market, partly through how expensive it was against its own history, and partly through how the financial press was talking about it. I returned to both halves of it later, in The Stock Market Hums with Hope and Do you know what CAPE is?. In the first phase of the build, the system formalises only the valuation half. It computes the CAPE percentile against the full distribution since 1871. It classifies the market into one of eighteen regimes. Every smart prediction is conditioned on the regime it was made in. The narrative half stays in the spreadsheet, for now.
WHAT THE AI STOCK MARKET PREDICTION SYSTEM ACTUALLY DOES
Daily, on my own machine, the build ingests S&P 500 OHLCV data, FRED macro indicators, and the Shiller CAPE series. It also pulls valuation fundamentals from yfinance.
It then computes valuation features. Trailing and forward P/E. Price to book. Dividend yield. CAPE percentile against the long historical distribution. From those features it labels today's regime, choosing one of eighteen. Five examples: low-volatility uptrend, high-volatility correction, range-bound, elevated valuation, or cyclical trough.
It then emits predictions for the S&P 500 across six horizons, from one day to twelve months. Each prediction is a probability distribution with a calibrated confidence number attached. It is not a single number.
Each prediction is graded at its review date. The record is never edited. The system judges itself by aggregates, not single hits. A minimum sample of thirty predictions per metric is required before any number is considered meaningful. The record began today. The interesting part of this series begins once it stops being small.
Join the Library
Full access to my thoughts, personal stories, findings, and what I learn from the people I meet.
Join the Library · €29.99 per yearGet the full article by email and feel free to reply if you want to discuss it further.
Disclaimer
Sources
Summary
Common questions on this article's topic
Can AI predict the stock market?
What does it mean to calibrate a prediction system?
Why is hit-rate a misleading metric for stock forecasts?
What is the CAPE ratio and why does it matter for S&P 500 forecasting?
Can a stock market forecasting system run locally without cloud services?
How do you keep a forecasting track record honest?
If you have any thoughts, questions, or feedback, feel free to drop me a message at mail@richardgolian.com.
 LinkedIn


Related articles
In April, in the first part of this series, I wrote about an AI prediction system I had started building on my own machine. At the time the software was a few hours old and the prediction record was empty. The record since then has shown one thing: the system does not yet understand the market it is being asked to forecast. It can pull macro context, book value, earnings. But it cannot put those together into something that helps it understand the price.
AI produces the graphic, the newsletter and the product page faster than a person. What is left for the one who used to do it is the judgement, knowing whether the output is good. But most people have worse judgement than AI. And whoever cannot judge quality cannot delegate either. How do you tell whether yours is the judgement a company relies on, or the kind it can replace?
Prague, 13 May 2026. On my way to work I started thinking about something that stayed with me for days. If most routine work on a computer disappears in the next ten years, and a large share of repetitive manual work disappears with it, what happens to the flow of money? Who pays whom for what? Which economic layers will exist, how large will they be, and what relationships will run between them? This is the six-layer map I sketched as an answer.
More articles
The same task, two models. Fable 5 against Opus 4.8. On paper Fable is the better model, with a larger context and stronger specs. And still it lost. Opus handled the task with a single round of checking for 721,000 tokens, while Fable needed nine rounds and burnt through 2.78 million tokens. The difference was not in the model, but in how I set the task. And I know it, because I measured it.
A few weeks ago I installed a small local AI model on my laptop that watches a live camera feed. I turned the webcam on in the dark, and in near total darkness it recognised me and the objects in the room. That such things exist, I have known for a long time. What opened my eyes was the accessibility. I installed it in one prompt, free, and it runs entirely on my machine, sending data nowhere.

I have Heidegger and my notebook beside me. I am asking where all of this is heading, where artificial intelligence is taking us.
Seventy per cent. That is where the first AI output begins, even when you give it the full company context and the best examples from the past. We are talking about the kind of output that cannot be defined programmatically. It is more complex. Often it is creative work. On one repeated type of output I reached eighty per cent within a week. Every further percentage point is harder than the one before.
For a long time we treated the internet as the main road. The place where work and relationships happen. Yet most of what we see on it today is, or soon will be, AI-generated: text, images, profiles and comments. The internet is turning into an online game full of bots, where you cannot be sure that a human is on the other side of anything. So I ask: was the online world the main road, or only a temporary detour that part of us will return from, back offline?
A few days ago I interviewed a senior marketer. An experienced man, years of practice. I asked him about AI. He said he barely uses it. He had one bad experience with the output and decided he was too senior for it to add value when it is not perfect. I know the other side too: professionals who automate everything that can be automated.
Europe does not have the capacity to face a full-scale, mass drone war of the kind we see in Ukraine. Three dependencies weaken it: China supplies the physical material for defence systems, the United States supplies capabilities Europe does not have, and twenty-seven states cannot agree how fast, or who pays. Rearmament plans exist, but they are being carried out slowly.

Four days in Catalonia. No computer, no AI, almost no social media. I bought this notebook so that I could write down what I would think about, and what I would come across and learn on the trip.